ApocalypseWatch
   
View the live dashboard
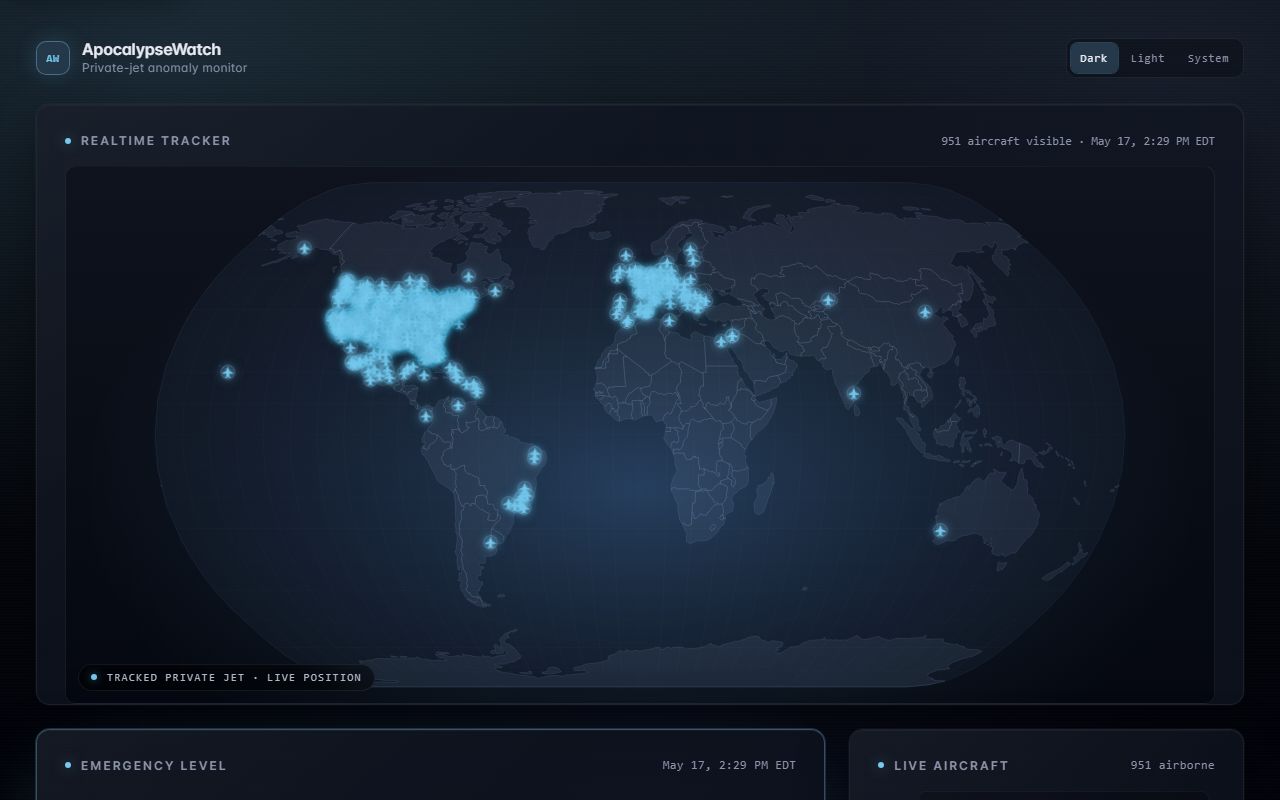
A premium realtime dashboard for monitoring a curated cohort of business jets against a rolling 24-hour baseline. If a meaningful number of those aircraft suddenly take to the skies, the dial moves toward 5.
This is an independent UI redesign of kylemcdonald/ews. The data pipeline (Node/Express server, ADS-B Exchange ingestion, FAA cohort importer, snapshot/RSS exporters) is reused unchanged so it stays compatible with Kyle McDonald's original deployment model. The frontend is rewritten from scratch.
What's different
Design system
- Dark, glass-first design with Catppuccin-inspired tokens, glassmorphism cards, and an accent color that shifts with the emergency level (cyan → teal → amber → orange → crimson)
- Light theme with
prefers-color-schemeauto-switch - High-contrast (
prefers-contrast: more) and Windows High Contrast (forced-colors: active) support prefers-reduced-motionandprefers-reduced-transparencyrespected- Touch targets sized for mobile (44px minimum on coarse pointers)
- Color-blind-safe SVG severity patterns alongside hue encoding
Dashboard components
- 5-segment SVG radial gauge with animated needle, numeric labels, and signal provenance drawer showing all calculation inputs
- Natural Earth map projection with glowing aircraft markers, heading rotation, and flight trails
- Recharts area chart with 24h / 7d / 30d / 1y range tabs, expected-baseline confidence band (±1σ), level transition annotations, and accessible data table toggle
- Sortable live aircraft list (callsign, model, altitude, speed)
- Level transition history log with timestamps and sigma values
- Dashboard state JSON export button for analysts and journalists
Realtime & reliability
- Server-Sent Events (SSE) with Last-Event-ID recovery, heartbeat keepalives, proxy-compatible headers (
X-Accel-Buffering: no), and configurable connection limit - Polling fallback with exponential backoff when SSE is unavailable (e.g., static GitHub Pages deployment)
- PWA with offline support, StaleWhileRevalidate caching, raster icons for home screen install
- Shareable URLs via
?range=query param synced to the chart time range - Embeddable status widget via
?embedquery param
Data pipeline
- Primary: ADS-B Exchange heatmap binary ingestion (unchanged from upstream)
- Fallback: Airplanes.Live v2 API adapter (
npm run update:api) — works with any ADSBx v2-compatible source (ADSB.lol, adsb.fi) - Secondary heatmap source: ADSB.lol globe_history daily archives (ODbL licensed, same binary format)
- Server-side archive date filtering (
GET /api/dashboard?range=24h) to reduce mobile payload - Data coverage audit script for detecting missing half-hour heatmap samples
- Database schema migration system with numbered SQL files
Notifications
- Telegram, Discord, ntfy multi-channel alerts with configurable
ALERT_MIN_LEVELthreshold - Discord webhook URL validation (pattern-matched, warns on malformed URLs)
- RSS emergency feed at
/rss.xml - Healthchecks.io dead-man's-switch for CI refresh workflows
DevOps
- GitHub Pages deployment with post-deploy smoke test and bundle verification
npm audit --audit-level=highgate in CI- Dependabot for npm, GitHub Actions, and pip dependencies
- Structured logging with Pino
- 26 unit tests for sigma calculation and RLE archive codec
Quick start
npm install
npm run dev
The API runs on http://localhost:3030 and the Vite client on http://localhost:5173. With no cohort imported, the dashboard serves synthetic demo data automatically.
Real cohort setup
npm run import:faa     # build the FAA-derived business-jet cohort
npm run backfill       # 365-day historical backfill
npm run update:daily   # nightly 1-day refresh
The default backfill reads tracked aircraft directly from SQLite — no separate watchlist file required.
Useful commands
npm run dev              # API + Vite client (concurrently)
npm run build            # production client bundle
npm run preview          # serve the built client
npm run lint             # ESLint over the client workspace
npm test                 # run unit tests (Node.js built-in test runner)
npm run import:faa       # import FAA cohort
npm run seed:demo        # seed synthetic data
npm run backfill         # 365-day backfill
npm run update:daily     # 1-day refresh
npm run update:api       # poll Airplanes.Live v2 API (fallback data source)
npm run export:snapshot  # static dashboard.json for Pages/R2
npm run rss:update       # update emergency RSS feed
npm run telegram:alert   # post Telegram emergency alert
Project layout
ApocalypseWatch/
├── client/              Vite + React 19 dashboard (rewritten)
│   └── src/
│       ├── components/  EmergencyGauge, GlobalMap, ArchiveChart, AircraftList,
│       │                Hero, AboutCard, StatusBanner, LevelHistory,
│       │                ThemeControl, EmbedView
│       ├── hooks/       useDashboard (SSE + polling)
│       ├── lib/         constants, format
│       └── styles/      theme.css, global.css, components.css
├── server/              Node/Express + better-sqlite3
├── scripts/             Python ADS-B/FAA ingestion, JS snapshot/RSS/Telegram,
│                        coverage audit, OG image generator, smoke tests
├── migrations/          Numbered SQL schema migrations
├── config/              R2 CORS, watchlist example
├── .github/workflows/   scheduled refresh + Pages deploy + Dependabot
├── schema.sql
└── requirements.txt
API contract
The client consumes a single endpoint:
GET /api/dashboard
GET /api/dashboard?range=24h   # server-side archive filtering (24h, 7d, 30d, 1y)
GET /api/stream                # SSE realtime push (with Last-Event-ID recovery)
GET /api/events?limit=100      # level transition history
GET /api/health                # server health + data gap detection
Dashboard snapshot shape:
{
  "mode": "demo" | "live",
  "warning": "...",                  // present in demo / unconfigured mode
  "cohort":   { "trackedCount": ... },
  "current":  { "asOf": "...", "concurrentCount": ..., "baselineMean": ..., "emergencyLevel": 1-5 },
  "signals":  { "composite": { "actualConcurrentCount", "expectedConcurrentCount", "sigmaShift", "emergencyLevel" } },
  "trends":   { "archive": { "v": 1, "t0": "...", "tr": [[1800000, n], ...], "c": [...], "p": [...], "s": [...] } },
  "liveAircraft": [{ "hex", "registration", "label", "lat", "lon", "altitudeFt", "groundSpeedKt", "track", ... }],
  "liveStatus":   { "providerLabel", "latestSampledAt", "lastError", "nextRefreshAt" }
}
Theming
Emergency level is set on <html data-emergency="N">. The --accent token re-resolves automatically and ripples through gauge, hero pulse, chart line, map markers, and background fx.
To force a level for design QA:
document.documentElement.dataset.emergency = '5'Public deployment
Two paths are wired up:
- GitHub Pages mirror — Live at sysadmindoc.github.io/ApocalypseWatch. The static client is published by
.github/workflows/deploy-github-pages.ymland reads the upstream public R2 snapshot directly, so it tracks the same live cohort and refresh cadence as the upstream site without running a parallel pipeline. - Self-hosted (Cloudflare model) — Same as the original: Cloudflare Pages (static client) + R2 (
dashboard.jsonsnapshot +data/ews.sqlite) + GitHub Actions for scheduled refresh. See.github/workflows/refresh-live-data.yml,refresh-daily-history.yml,deploy-pages.ymland the original ews README's "Public deployment" section for credentials and secrets.
Embed widget
Append ?embed to the dashboard URL for a compact, iframe-friendly status badge:
https://sysadmindoc.github.io/ApocalypseWatch/?embedCredits
- Original concept, data pipeline, FAA importer, ADS-B Exchange heatmap parsing, deployment model: Kyle McDonald
- Frontend redesign: SysAdminDoc
License
MIT — see LICENSE.